
For fifteen years, Silicon Valley's mega-cap technology platforms commanded premium valuation multiples for one structural reason: near-zero marginal distribution costs coupled with low physical capital intensity. A dollar of incremental software or digital advertising revenue required pennies of property, plant, and equipment (PP&E). That regime has ended.
Across Microsoft, Alphabet, Amazon, and Meta, annual capital expenditures have surged from roughly $140 billion in 2022 to an annualized run-rate exceeding $310 billion by late 2026. When sovereign wealth buildouts, neo-cloud debt facilities (CoreWeave, Lambda, Crusoe), and enterprise private clusters are included, cumulative global AI infrastructure capital formation crosses the $1 trillion threshold. The central question for institutional capital is no longer whether frontier models work—it is whether the net present value of incremental AI cash flows can outrun the fastest hardware depreciation cycle in industrial history.
1. The Balance Sheet Mutation: Software Margins Meet Heavy Industry
Historically, telecommunications and energy buildouts follow a boom-bust trajectory driven by asymmetric game theory. Management teams at Alphabet, Meta, and Microsoft explicitly state in quarterly earnings disclosures that the risk of under-investing (losing platform lock-in during an architectural paradigm shift) vastly outweighs the risk of over-investing (carrying excess compute capacity for eight quarters).
| Hyperscaler Entity | Est. Annualized Capex Run-Rate (2026) | Capex as % of Operating Cash Flow | Primary Custom Silicon / Merchant Mix |
|---|---|---|---|
| Amazon (AWS) | ~$85B – $92B | ~68% | NVIDIA Blackwell + AWS Trainium2 / Inferentia |
| Microsoft (Azure) | ~$78B – $84B | ~64% | NVIDIA H200/B200 + Azure Maia 100/200 |
| Alphabet (Google Cloud) | ~$62B – $68B | ~56% | Google TPU v5p / v6 (Trillium) + NVIDIA Merchant |
| Meta Platforms | ~$58B – $65B | ~61% | NVIDIA H100/B200 Clusters + Meta MTIA v2 |
Notice the second column: capital expenditure now consumes between 56% and 68% of gross operating cash flow across the Big Four. Unlike fiber-optic cables buried in the late 1990s—which retained a physical useful life of 20 to 25 years—merchant AI accelerators account for roughly 60% to 70% of data center cost inside the shell and face rapid economic obsolescence.
2. The Depreciation Cliff and the Revenue Amortization Gap
Under GAAP accounting rules, capital expenditures do not hit the income statement immediately. Instead, they sit on the balance sheet as PP&E and flow through the income statement over time as depreciation expense. Between 2022 and 2024, Microsoft, Amazon, Alphabet, and Meta all extended the accounting useful life of their server and networking equipment from 3–4 years to 5–6 years.
While a 6-year depreciation schedule flatters near-term GAAP operating margins, physical silicon physics move on an 18-to-24-month cadence. Each architectural leap—from NVIDIA Hopper (H100) to Blackwell (B200) to Rubin—delivers a 3x to 5x improvement in tokens-per-watt-hour. A cluster of older GPUs becomes economically uncompetitive for frontier inference long before its 6-year accounting life expires, creating the risk of concentrated impairment write-downs if utilization rates slip below 65%.
3. The Physical Bottleneck: Power Grids, Substations, and Thermodynamics
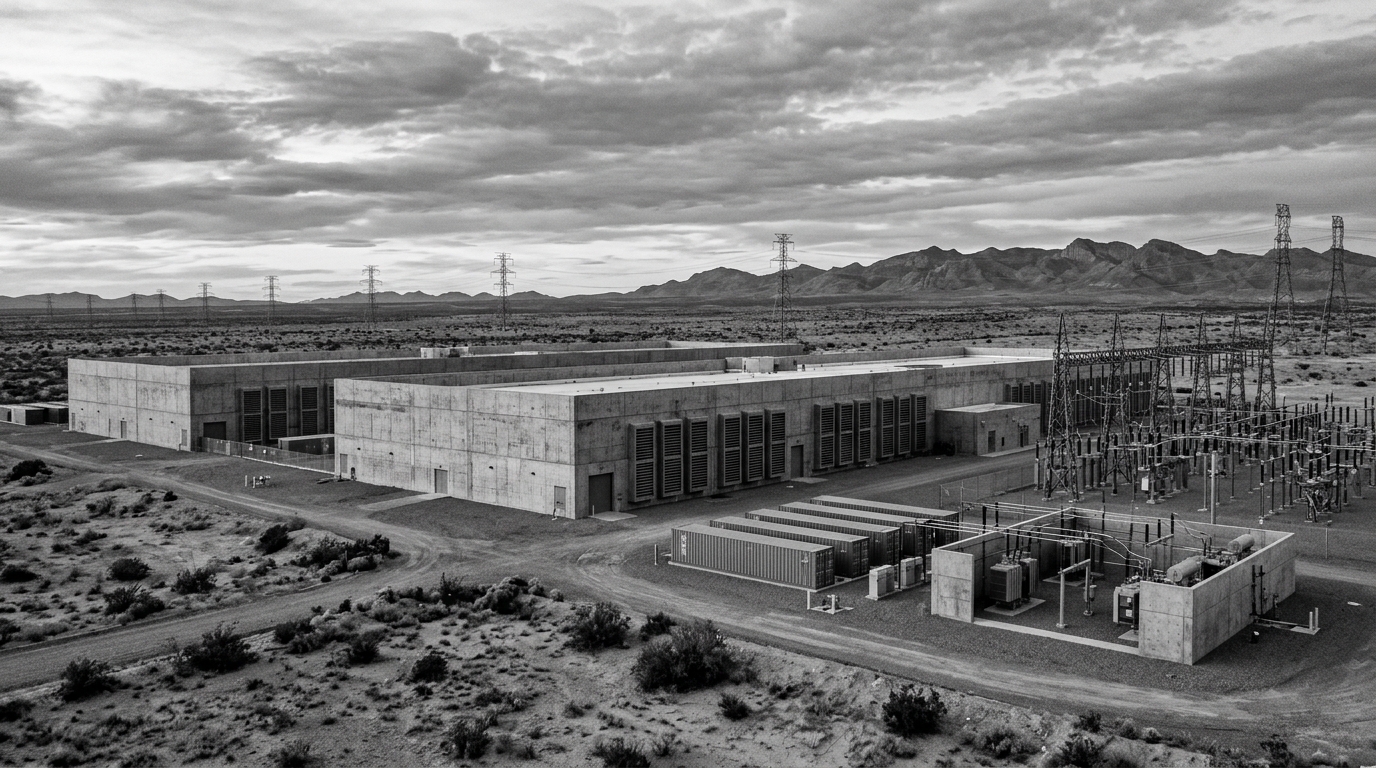
Until early 2025, TSMC's CoWoS (Chip-on-Wafer-on-Substrate) packaging capacity was the primary constraint on AI cluster deployment. Today, the binding constraint has migrated from semiconductor foundries to regional electrical grids and high-voltage step-down transformers.
- Rack Power Density Escalation: Legacy cloud CPU racks consumed 8 kW to 15 kW per rack and relied on standard raised-floor air cooling. An NVIDIA GB200 NVL72 rack demands 120 kW to 132 kW per rack, mandating direct-to-chip liquid cooling loops and facility-wide retrofits.
- Grid Interconnection Queues: In primary US data center corridors such as Northern Virginia (PJM interconnection) and Santa Clara, new utility transmission hookups exceeding 100 MW face interconnection study backlogs of 4 to 7 years.
- Behind-the-Meter Nuclear & Gas Deals: To bypass transmission delays, hyperscalers are signing 20-year Power Purchase Agreements (PPAs) directly at the generation source—exemplified by Microsoft's agreement to restart Three Mile Island Unit 1 (835 MW) and Amazon's co-location investments alongside nuclear and natural gas turbines.
4. Modeling Cluster TCO: Merchant GPUs vs. Custom ASICs
To defend gross margins against merchant GPU pricing power (where NVIDIA commands 75% gross margins), every hyperscaler has accelerated internal custom ASIC programs—Google's TPU v6, Amazon's Trainium2, and Meta's MTIA. Even before software monetization begins, the baseline four-year economics of a 10,000-accelerator pod ($38,000 per chip including optics and networking, 1.2 kW thermal load with cooling overhead, and $68/MWh industrial power) are unforgiving.
Under those parameters, a single 10,000-GPU pod requires $380 million in upfront hardware and networking capex, plus nearly $28.6 million in electricity over four years—bringing total four-year cost of ownership to $408.6 million ($1.17 per chip-hour just to break even). To achieve a standard 55% cloud gross margin, that single 10,000-chip cluster must generate $227 million in annual top-line revenue every single year of its 4-year lifecycle. Scaled across a $1 trillion global buildout, the software ecosystem must generate over $550 billion in net-new annual recurring revenue (ARR) simply to clear cost-of-capital hurdles.
5. The Inference Paradox: Test-Time Compute Rescues Utilization
Critics of the capex boom point out that raw token inference prices have fallen by roughly 80% per year due to quantization, speculative decoding, and Mixture-of-Experts (MoE) architectures like DeepSeek-R1. In a classic commodity market, falling unit prices destroy supplier revenue unless demand elasticity is substantially greater than 1.0 (Jevons Paradox).
Two structural shifts are absorbing this capacity in 2026:
- Test-Time Compute Scaling (Reasoning Chains): Rather than emitting a single-pass completion of 300 tokens, reasoning models (OpenAI o-series, Claude Extended Thinking, DeepSeek-R1) generate 5,000 to 50,000 internal chain-of-thought verification tokens per query, multiplying inference compute consumption by 20x to 100x per user action.
- Autonomous Background Agents: Human-in-the-loop chat is bounded by human typing and reading speed. Autonomous coding and data agents operate asynchronously in loops—compiling code, running test suites, querying databases via MCP, and self-correcting—consuming continuous megawatt-hours without human keyboard input.
| Workload Archetype | Avg. Tokens Consumed per Task | Compute Intensity Multiplier | Primary Monetization Model |
|---|---|---|---|
| 2023 Standard Chat Query | ~600 tokens | 1x (Baseline) | $20/mo Flat Seat Subscription |
| 2025 RAG Enterprise Search | ~8,500 tokens | ~14x | Per-Seat + API Tiered Quota |
| 2026 Autonomous Coding / Research Agent | ~120,000 – 450,000 tokens | 200x – 750x | Usage-Based Compute Credits & Outcome Pricing |
6. Neo-Cloud Debt Structures and GPU-Backed Securitization
While the Big Four hyperscalers fund their data center buildouts out of internal operating cash flow and investment-grade corporate bonds, a second tier of specialized GPU cloud providers—commonly termed "neo-clouds" (such as CoreWeave, Crusoe, and Lambda)—has pioneered an aggressive new asset class: GPU-collateralized private credit.
Over the past 24 months, private credit funds (Blackstone, Magnetar, Brookfield, Carlyle) have extended over $25 billion in high-yield debt facilities secured directly by physical H100 and Blackwell server racks. The underwriting logic relies on take-or-pay compute lease contracts signed by investment-grade anchor tenants (frequently Microsoft or major frontier model labs) spanning 3 to 5 years.
| Financing Parameter | Tier-1 Hyperscaler Self-Funding | Neo-Cloud GPU-Backed Private Credit |
|---|---|---|
| Weighted Average Cost of Capital (WACC) | 4.2% – 5.1% (AA/AAA Corporate Debt + Cash) | 9.5% – 13.5% (SOFR + 450–800 bps Senior Secured) |
| Primary Collateral | Diversified Cloud, Search, Ads, & Enterprise SaaS | Dedicated GPU Pods & Anchor Lease Receivables |
| Refinancing / Rollover Risk | Negligible; absorbed by consolidated balance sheet | High if spot GPU hourly rental rates drop >40% at lease expiry |
This bifurcated capital structure means that if enterprise AI adoption encounters even a temporary two-quarter digestion pause, stress will not appear first on Microsoft's or Alphabet's balance sheet. Instead, the canary in the coal mine will be secondary-market spot hourly rental rates for H100/B200 instances and the credit spreads on neo-cloud asset-backed facilities. When spot GPU rental pricing falls below the debt-service breakeven threshold (~$1.35/hour per chip including financing costs), leveraged compute lessors face rapid collateral revaluation.
Watch hyperscaler capital allocation disclosures over the next two quarters for a decisive signal: the ratio of capex directed toward training clusters versus regional inference pods. When inference capex surpasses 65% of total spend, the buildout transitions from speculative R&D into demand-backed industrial cash flow.
Comments
0