When Oracle reported $664.0 billion in Remaining Performance Obligations (RPO) in its fiscal Q1 2027 disclosures, financial news desks treated the figure as an unassailable victory lap. For anyone who has built distributed infrastructure or managed cluster capacity under a hyper-growth mandate, that headline triggered a colder reflex. In distributed systems, an unacknowledged message queue is not throughput; it is backpressure waiting to trigger an out-of-memory crash. On an industrial balance sheet, $664.0 billion in unamortized cloud backlog operates by the exact same physics. A signed multi-year compute lease does not wire cash into a corporate treasury today. Instead, it obligates the operator to pour tens of billions of dollars into concrete pads, liquid-cooling manifolds, high-voltage substations, and GPU racks 18 to 30 months before the first megawatt-hour of billable inference traffic ever clears a meter.
Tracing the divergence between Oracle's equity narrative and its cash flow statement exposes the central tension of the late-cycle AI buildout. Beneath the $664.0 billion RPO headline sits an annualized capital expenditure commitment of $75.60 billion ($18.90 billion per quarter) colliding against $54.00 billion in annualized operating cash flow ($13.50 billion per quarter). That math leaves an immediate free cash flow deficit of -$5.40 billion per quarter, or -$21.60 billion on an annualized run-rate. Contracted demand is no longer the constraint. Converting paper backlog into recognized revenue now hinges on surviving a capital-intensive war of attrition across county zoning boards, state land offices, and post-midterm environmental dockets.
The Accounting Mirage: $664.0 Billion in RPO Meets a $75.60 Billion CapEx Bill
Sell-side equity models routinely conflate Remaining Performance Obligations with near-term free cash flow yield. Under ASC 606 revenue recognition standards, an RPO entry simply aggregates the total dollar value of contracted, unfulfilled cloud capacity leases—typically structured across 5-to-8-year (6.5-year median, or 78-month) take-or-pay schedules with frontier model labs and sovereign AI buyers. While the nominal headline ratio of backlog to annualized capital expenditure stands at 8.78x ($664.0 billion RPO divided by $75.60 billion in annualized CapEx), the cash conversion timeline is inverted. Every dollar of future RPO requires upfront capital deployment before revenue recognition can legally commence.
Examine the quarterly cash flow mechanics. At an operating cash flow baseline of $13.50 billion per quarter ($54.00 billion annualized) and a capital expenditure burn of $18.90 billion per quarter ($75.60 billion annualized), Oracle's CapEx-to-Operating-Cash-Flow ratio hits 1.40x (140.0%). Rather than self-funding its expansion out of legacy database and middleware cash flows, the company must bridge a -$21.60 billion annualized free cash flow gap through investment-grade bond issuances, project-level private credit facilities, and structured lease obligations.
The Pre-Energization Carry Trap
When a cloud operator finances 70-to-130-kilowatt-per-rack liquid-cooled GPU halls using debt and structured developer leases, time becomes a punitive variable. Consider the unit economics of a flagship 2.45-gigawatt (2,450 MW) hyperscale campus—such as Project Jupiter in Doña Ana County, New Mexico—underwritten against $42.00 billion in Phase-1 pre-energization capital commitments at a 6.50% blended debt and lease carry rate. That capital structure imposes a fixed carrying cost of $2.73 billion per year ($227.50 million per month) before a single rack begins billing.
At full commercial operation, each energized megawatt of total campus power yields approximately $12.00 million in gross annual cloud lease revenue, equating to $29.40 billion in peak annual revenue across all 2,450 MW. Assuming a 65.0% cash operating margin (EBITDA/OCF basis), peak annual operating cash inflow reaches $19.11 billion. However, if physical energization stalls due to fuel-supply or air-quality permitting bottlenecks, fixed debt service rapidly erodes project returns. Dividing the $2.73 billion annual carry by the $19.11 billion peak cash inflow reveals a hard mathematical floor: the campus must achieve a minimum realized energization rate of 14.29% (350.0 MW of active, billing capacity) merely to cover its annual financing carry.
| Campus Deployment Scenario (2,450 MW Peak Capacity) | Peak Capacity (MW) | Realized Energized Load (MW / %) | Realized Annual Revenue ($B)* | Operating Cash Inflow @ 65% Margin ($B) | Fixed Debt & Lease Carry ($B/Yr) | Net Annual Cash Spread ($B)* |
|---|---|---|---|---|---|---|
| Scenario A: Baseline On-Schedule Energization | 2,450.0 MW | 2,082.5 MW (85.0%) | $24.99B | $16.24B | $2.73B | +$13.51B |
| Scenario B: Mild Permitting Slip (9-Mo Air Review) | 2,450.0 MW | 1,347.5 MW (55.0%) | $16.17B | $10.51B | $2.73B | +$7.78B |
| Scenario C: Pipeline Right-of-Way Freeze (Midterm Grid Block) | 2,450.0 MW | 612.5 MW (25.0%) | $7.35B | $4.78B | $2.73B | +$2.05B |
| Scenario D: Force Majeure Stall (Microgrid Fuel Blocked) | 2,450.0 MW | 245.0 MW (10.0%) | $2.94B | $1.91B | $2.73B | -$0.82B |
*Methodology Footnote: Realized Annual Revenue ($B) = (Peak Capacity MW × Realized Energized Load % × $12.00M Gross Yield per MW) ÷ 1,000. Operating Cash Inflow ($B) = Realized Annual Revenue × 0.65. Fixed Debt & Lease Carry ($B/Yr) = $42.00B Phase-1 Committed Capital × 6.50% Blended Rate = $2.73B. Net Annual Cash Spread ($B) = Operating Cash Inflow - $2.73B (exact breakeven threshold is 14.29% or 350.0 MW).
What the Market Missed: Data Center Politics and the Project Jupiter Standoff
For the past three years, equity analysts treated TSMC's CoWoS packaging capacity and Nvidia's Blackwell/Rubin rack shipments as the sole governors of AI revenue growth. That mental model is obsolete. Silicon is no longer the primary bottleneck; permissioned megawatts are. And in the United States, permissioned megawatts are governed by local zoning boards, state land commissioners, and partisan energy politics.
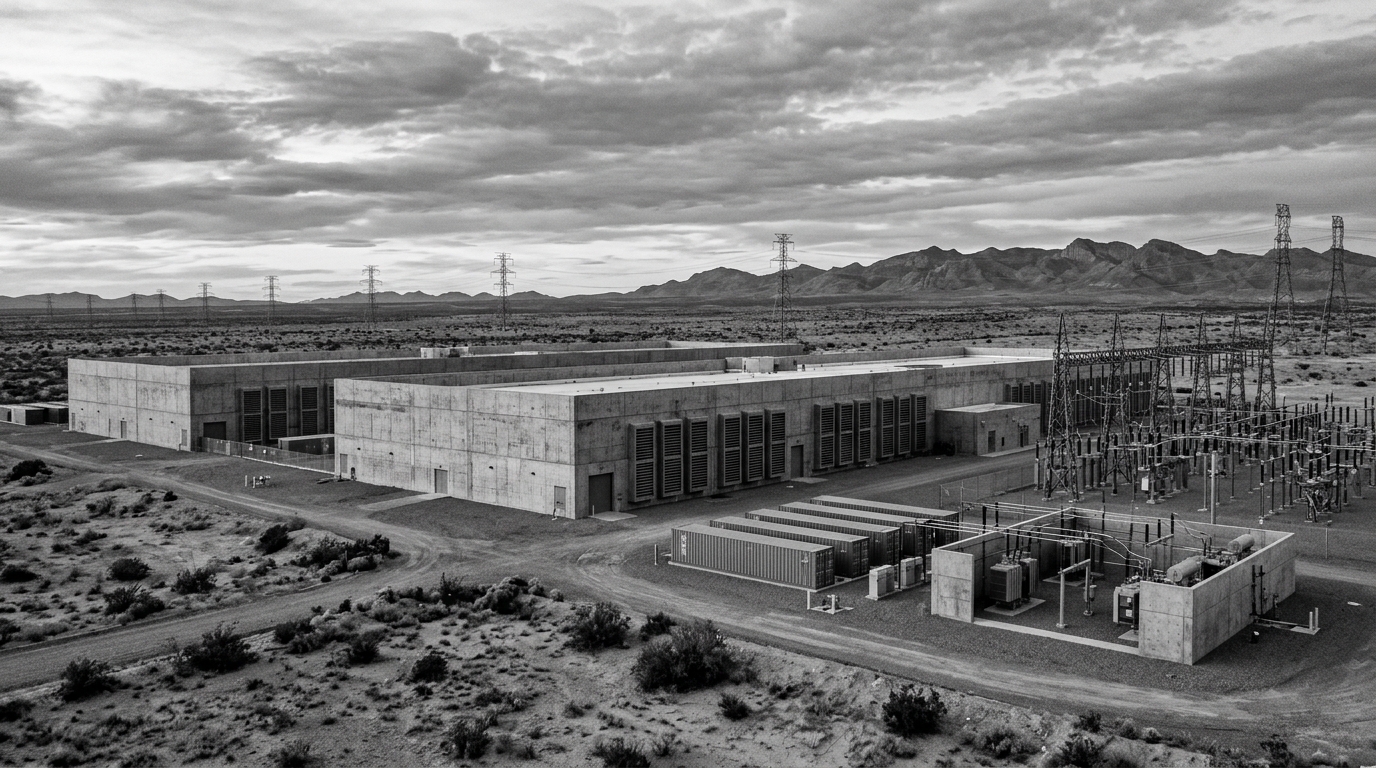
Nowhere is this friction more visible than at Project Jupiter—the $165.0 billion, 1,400-acre AI supercomputing campus in Doña Ana County, New Mexico, developed by STACK Infrastructure (backed by Blue Owl Capital) and BorderPlex Digital Assets with Oracle serving as the principal anchor tenant for OpenAI's Stargate workloads. Because regional electric utility interconnection queues in the Southwest stretch five to seven years, Project Jupiter's architects engineered a classic Silicon Valley workaround: bypass the public transmission grid entirely by building a 2.45-gigawatt behind-the-meter microgrid powered by Bloom Energy solid oxide fuel cells running on continuous natural gas.
Midterm Grid Politics, Right-of-Way Denials, and Force Majeure
Bypassing the electric utility did not bypass the state regulator. To feed 2,450 MW of fuel cells, Project Jupiter relies on high-pressure natural gas delivered via Energy Transfer's regional Green Chile pipeline. As the US midterm election cycle intensified Democratic regulatory scrutiny over fossil-fuel infrastructure, municipal water consumption, and residential electricity ratepayer protection, Project Jupiter walked straight into a political crossfire:
- State Land Office Easement Denials: The New Mexico State Land Office pushed back against right-of-way easements required for the natural gas pipeline route, citing environmental stewardship and community impact across borderland parcels.
- Air-Quality Permitting Extensions: Power facility developers (including Yucca Cross Infrastructure) encountered protracted technical reviews and public hearing postponements before the New Mexico Environment Department (NMED) over Title V air-quality construction permits for multi-gigawatt continuous gas generation.
- The September 2026 Force Majeure Notice: Confronted with slipping pipeline and air-permit timelines that threatened the campus's 2028 commercial operation target, Oracle took an extraordinary legal step in late September 2026—issuing a formal force majeure notice to Blue Owl Capital and STACK Infrastructure.
Oracle did not walk away from Project Jupiter, nor did its underlying demand evaporate. Instead, the force majeure filing was a cold-blooded balance-sheet defense. By formally invoking regulatory and utility supply delays as unforeseeable external events, Oracle preserved its contractual right to defer lease commencement payments and shield itself from dead-weight carrying costs while permitting battles play out. The credit market reacted instantaneously: construction debt tied to the development traded below par, repricing the political risk of behind-the-meter AI microgrids across every jurisdiction in North America.
Crisis or Economic Moat? The Contrarian Case for Regulatory Attrition
At first glance, a -$21.60 billion annualized free cash flow burn paired with a force majeure dispute at a flagship 2.45 GW campus reads like an existential bear case. Step back and view the chessboard like an infrastructure monopolist: this exact regulatory and financial gauntlet is forging Oracle's most durable economic moat.
Ask a simple structural question: if a $165.0 billion campus backed by Oracle, OpenAI, and Blue Owl Capital faces multi-quarter delays over New Mexico pipeline easements and NMED air-quality hearings, what happens to an undercapitalized Series C "neocloud" attempting to build a 500 MW cluster? It dies in the permitting queue.
When capital costs sit at 6.50% and state environmental agencies extend review cycles by 12 to 24 months, regulatory friction acts as a filter that eliminates thinly capitalized competitors:
- Balance Sheet Endurance: Neocloud startups financed via 11%–14% mezzanine GPU debt cannot survive two years of zero-revenue permitting delays while paying $227.50 million per month in capital carry. Oracle, anchored by $54.00 billion in high-margin recurring operating cash flow from mission-critical enterprise databases, can absorb temporary negative free cash flow and refinance across multi-decade corporate bond curves.
- Contractual Asymmetry: As demonstrated by the September 2026 force majeure notice, a tier-one anchor tenant possesses the legal leverage to shift construction-delay and pipeline-permitting carry risk back onto real estate developers and private credit sponsors (Blue Owl / STACK).
- Scarcity Rent on Permissioned Megawatts: Every municipal moratorium, air-quality hearing extension, and pipeline right-of-way denial restricts aggregate industry supply of 100+ kW/rack compute halls. Once Oracle muscles Project Jupiter and its peer campuses through the regulatory bottleneck, the resulting energized megawatts become non-replicable regulated assets—commanding structural pricing power in a consolidated cloud oligopoly.
Short-term free cash flow compression is not a sign of broken unit economics; it is the entry fee required to corner a regulated utility cartel.
The Infrastructure Underwriting Playbook: A Three-Stage Triage Protocol
For founders, infrastructure allocators, and public equity investors evaluating the next wave of AI infrastructure beneficiaries, headline RPO growth is a vanity metric. Separating durable compounders from impending liquidity traps requires a strict three-stage quantitative underwriting protocol:
- Audit the CapEx-to-OCF Ratio and RPO Conversion Velocity: Divide forward annualized capital expenditure by trailing operating cash flow (
CapEx ÷ OCF). Any operator running above1.25x(such as Oracle at1.40xwith $75.60B CapEx against $54.00B OCF) is structurally dependent on external capital markets. Track the quarterly ratio of recognized cloud revenue to total RPO (Quarterly Recognized Cloud Revenue ÷ Total RPO); if backlog surges while conversion velocity stagnates below 3.2% per quarter, physical energization bottlenecks are choking revenue recognition. - Underwrite County-Level Siting and Fuel-Path Permitting (Not Federal Rhetoric): Ignore federal AI executive orders and CHIPS Act press releases. Inspect the physical critical path at the county and state level: State Land Office pipeline right-of-way dockets, state environmental department air-quality construction permits (Title V), municipal water allocation caps, and upcoming state gubernatorial or utility commission elections.
- Price in Pre-Energization Financing & Credit Spread Events: Before buying an equity breakout on a multi-billion-dollar backlog announcement, calculate how many months of negative FCF the balance sheet must bridge before the underlying data centers energize. Monitor project-level construction debt pricing, mandatory convertible preferred issuances, and force majeure lease covenants—credit spreads always price permitting delays six months before equity multiples adjust.
Track New Mexico Environment Department air-quality dockets and secondary-market pricing on Blue Owl / STACK project construction loans over the next two quarters; those credit spreads will signal whether Oracle's $664.0 billion backlog is converting into cash or waiting on a blocked pipeline. Until state-level permitting clears, treat unenergized RPO as an unfunded capital liability—and accumulate the survivors only after the credit market prices in the delay.
Editorial Disclaimer: This analysis is published by Signal and Drift for informational and educational research purposes only. Nothing herein constitutes investment, legal, or tax advice, nor a recommendation to buy or sell any security or digital asset.


Comments
0